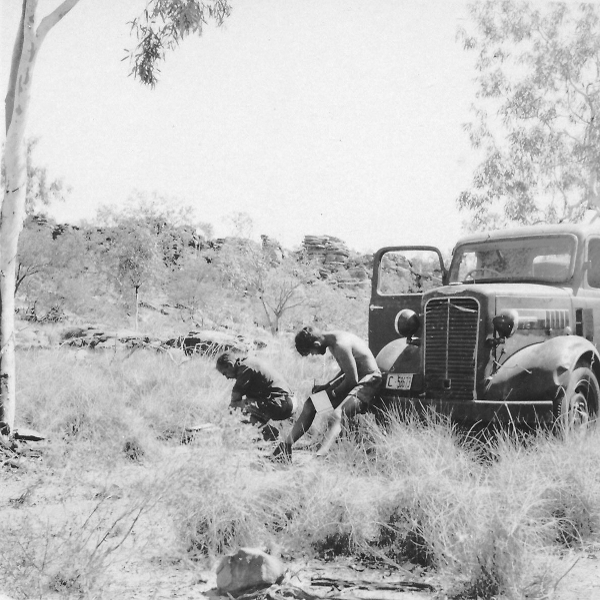
Figure 5. Reading the Aneroid Barometers. Note
headlamps on the Commer truck turned aside to
protect the glass and bulbs.
>> Next >>
|
Equipment A Wild T2 theodolite was used for the star observations with a Mercer half second beat chronometer and Doxa stopwatch being used for timing the star transits. The chronometer was compared before and after the observation against the one second beats of WWV National Bureau of Standards, Washington D.C. or WWVH, Hawaii time signals on the AWA 3BZ wireless receiver. During 5 field seasons the Mercer chronometer, which was gimbal mounted in a sponge rubber lined box, travelled with gimbals locked on the floor in the front of the truck and in spite of this rough travelling maintained a fairly constant rate of 1-3 seconds a day. Times change! Compare this with my $25 digital wrist watch which has gained about 3 seconds a month during the past 4 years and does not need winding every morning and evening. The 3BZ wireless was a mass of valves, condensers and wires in a bulky metal box about 30 x 30 x 50 cm with a separate speaker, and constantly needing replacement of a valve called -6V6. So long as the aerial was well placed the WWVH time signals were usually clear on 10 MHz and only faded during October, but these days, the days of the transistor, WWVH and of course the more accurate Australian VNG signal booms in on a radio which can be carried in the pocket - including the batteries! Barometer Heighting Atmospheric pressures were read from a battery of four Short & Mason 5" aneroid barometers and, in later seasons, altitudes from Kollsman aircraft type altimeters, at creek crossings, homesteads, bores, airstrips and generally along the track at four mile intervals ie, every one inch on the map. Figure 5. Relying on the usually smooth pressure gradient during the dry season over the low relief of central Australia, heights were obtained using a long-range barometer heighting method of interpolating from three selected meteorological stations some 600 km apart; for example Tennant Creek, Mount Isa and Alice Springs for heighting in, say, the Sandover River area. The original Kew mercury barometer atmospheric pressure readings were obtained from the Meteorological Bureau, corrected for index error, gravity and temperature then plotted as time-pressure curves for the three selected stations to allow pressures to be read for any particular time. Simple analysis of the pressure in a specified plane above the field observation which when compared with the pressure recorded at the field station gave a pressure difference and hence the field station height. This method was applied by Rimington following work done by Squires (1947). The accuracy of this method of heighting was difficult to assess; however, comparison of heights obtained for the same point on different days, even different years agreed usually within 15 metres. There was no doubt about the interest at the time in these heights, maybe a case of anything is better than nothing, with the heights being used, apart from topographic mapping and ICAO aeronautical charting, for Professor E. Sherborn Hills' model of Australia, sub-artesian water table studies and river gradients. |
Aerial Photography
Aerial photographs used in this survey were obtained by 87 Squadron of the Royal Australian Air Force using a Fairchild K17, 230 x 230/150 mm camera in a Mosquito aircraft at 7,600 metres giving a nominal photo-scale of 1:50 000. A major aerial photography programme wasundertaken by the RAAF 87 Squadron in Northern Australia during 1947-52. Some idea of the size of this operation can be gained from the fact that during the 1948 season the RAAF photographed approximately 650,000 square kilometres of Northern Australia (Vincent 1984). The RAAF 87 Squadron continued to acquire aerial photography for Commonwealth purposes until 1953 when Natmap was given the responsibility and arranged for aerial photography to be obtained under contract. Existing Mapping Information The existing survey and map information available in 1948 was rather sketchy, consisting of the N.T. small-scale 800 chain, 10 mile to the inch series and the Army 8 mile to the inch, 1:506,880 series emergency mapping; as John Manifold wrote - although to be fair I think he had the maps of the more remote World War II campaign areas in mind - 'The standard map admits it doesn't know. The hinterland, you see, is barely tinted, Not contoured in; besides, this sheet was printed for eyewash sake, in peacetime, years ago!Although the draftsmen were preparing photo-index maps as quickly as possible after the photo coverage became available, these took some time to reach us in the field, and in order to get an idea of the country where the astrofixes were to be done, it was sometimes necessary to lay out the photos which meant finding a reasonably flat spot out of the wind, a supply of stone paperweights and making a rough "shingle mosaic" of the photographs. There were usually 15 runs with 40 photos in each run covering a four mile map area, 1½ degrees of longitude by 1 degree of latitude, a total of 600 photos with 60% endlap or 300 when every second photo was laid down. To highlight the lack of reliable topographic information and keeping in mind the practice of naming map sheets after a major feature within the map area, it is interesting to note that the Sandover River, which is a major feature, flowing east on Elkedra map divides into three floodout channels which end about 10 km from the adjoining map to the east which is named Sandover River. A great deal of useful information was obtained from the local people and we were happy to reciprocate whenever possible. Natmap worked in the southwest area of the Sandover River sheet with N.T. Administration, Chief Field Officer Les Clough, Field Officer Dick McBride and Charlie Simmons and later with Doug Macinnes in the Wave Hill-Victoria River Downs Area providing astrofix position information for pastoral lease resumptions. See Figure 6. |